

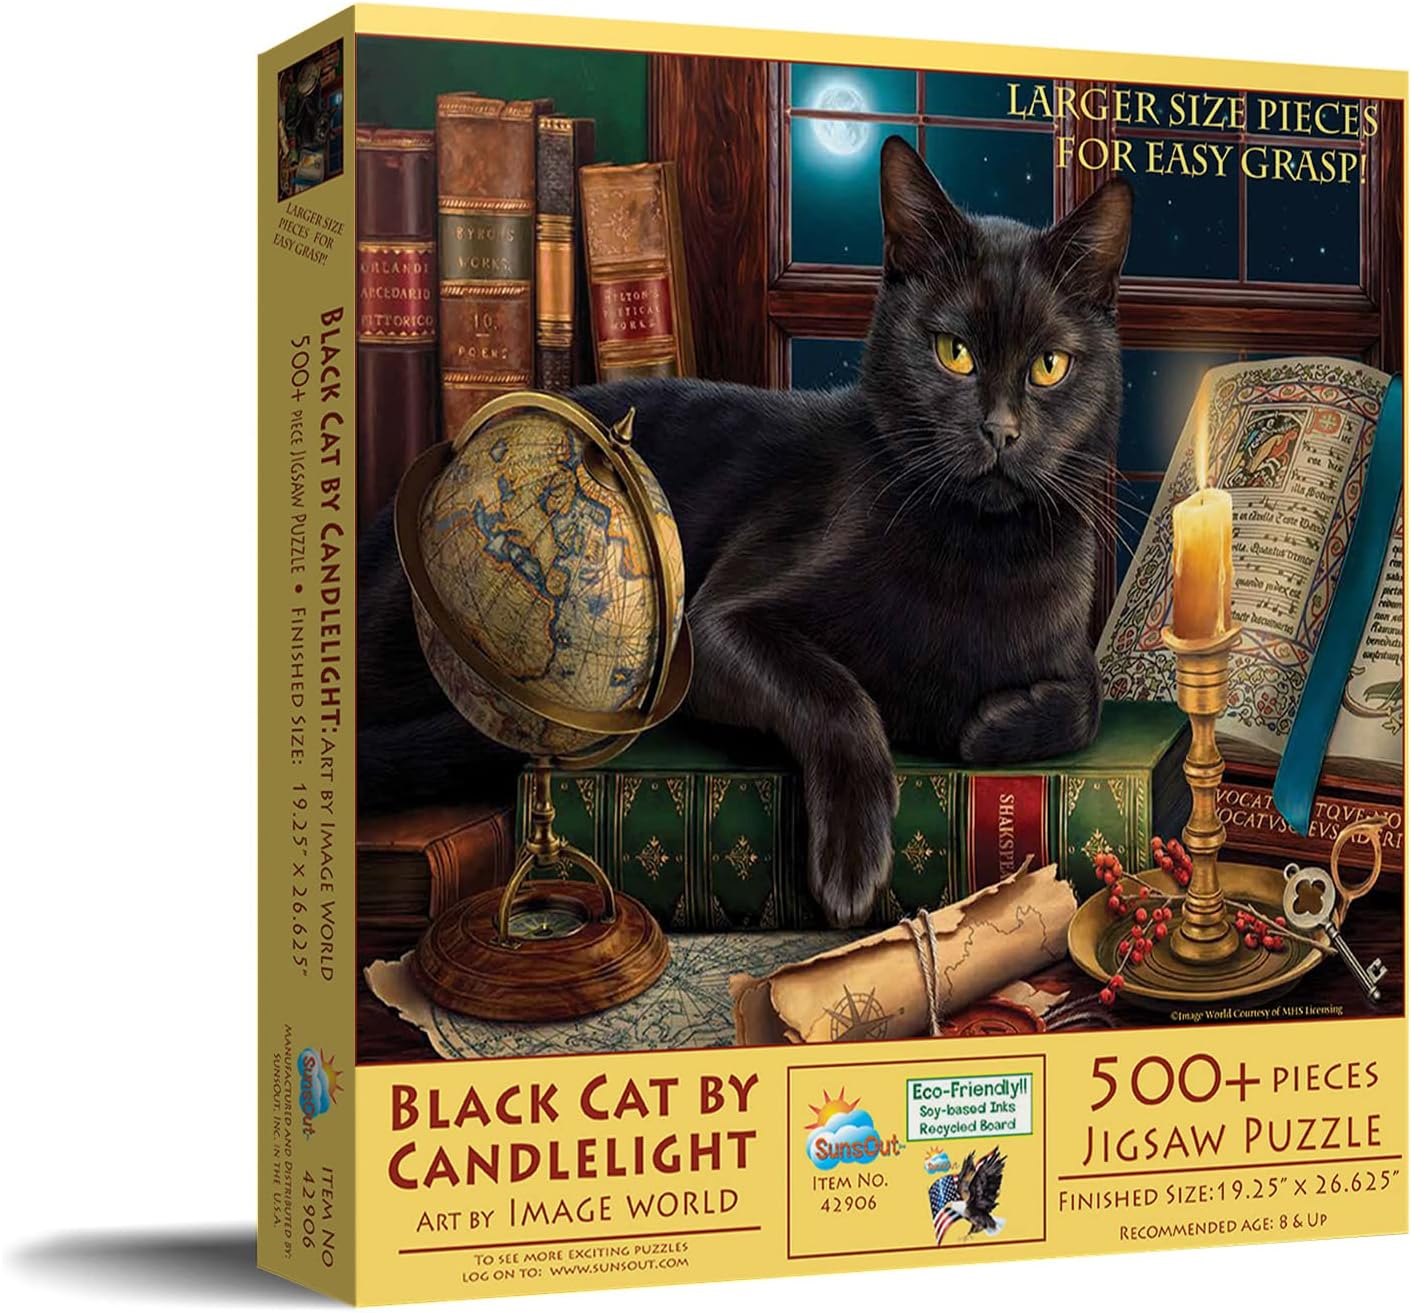
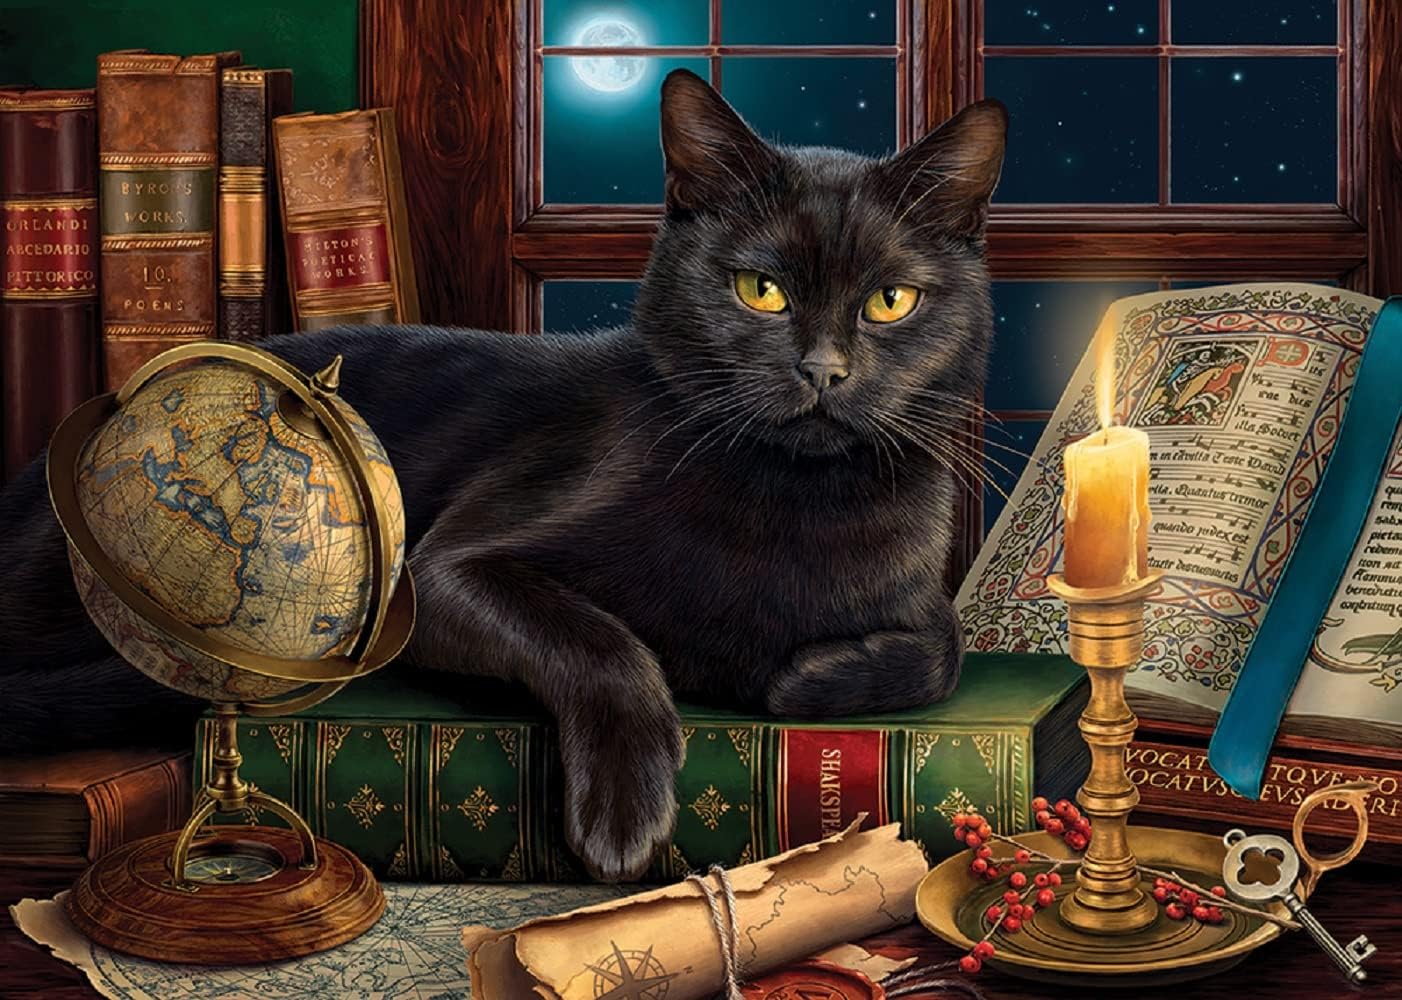
SUNSOUT INC - Black Cat by Candlelight - 500 pc Large Pieces Jigsaw Puzzle by Artist: Image World - Finished Size 19.25" x 26.625" - MPN# 42906
US$6.60
Price when purchased online
Free shipping
Free 30-day returns
Sold and shipped by librare.in
We aim to show you accurate product information. Manufacturers, suppliers and others provide what you see here.
US$6.60
Price when purchased online
Free shipping
Free 30-day returns
Sold and shipped by librare.in
Free 30-day returns Details
Product details
| Management number | 219572883 | Release Date | 2026/05/03 | List Price | US$6.60 | Model Number | 219572883 | ||
|---|---|---|---|---|---|---|---|---|---|
| Category | |||||||||
- Black Cat by Candlelight (Oversized pcs) 500 pc Jigsaw Puzzle by SunsOut
- 500 Piece Large Pieces Jigsaw Puzzle - Completed Size: 19.25" x 26.625" - Puzzle Artist: Image World
- Interlocking Pieces and Durable Construction: SunsOut jigsaw puzzles feature interlocking pieces that fit securely, making assembly easier and reducing frustration.
- Ages: 15 years and older - Perfect for adults and seniors. SunsOut puzzles ensure high manufacturing standards ensuring their commitment to quality and customer service.
- SunsOut puzzles use soy based inks, high quality puzzle board. As this is a jigsaw puzzle: assembly is required and batteries are not required.
| UPC | 796780429062 |
|---|---|
| Size | 500 Large Pieces |
| Color | Multicolor |
| Theme | Animals, Map, Outer Space, Science Fiction |
| Set Name | Black Cat by Candlelight |
| Brand Name | SunsOut |
| Item Shape | Rectangular |
| Unit Count | 1.0 Count |
| Item Weight | 8 ounces |
| Puzzle Type | Jigsaw |
| Skill Level | Beginner |
| Manufacturer | SUNSOUT INC |
| Model Number | 42906 |
| Material Type | Cardboard |
| Product Style | Classic |
| Operation Mode | Manual |
| Item Dimensions | 19.37 x 19.37 x 0.04 inches |
| Number of Items | 500 |
| Number of Pieces | 500 |
| Number of Players | 1 |
| Subject Character | Cat |
| Additional Features | Portable |
| Included Components | Jigsaw Puzzle Pieces |
| Is Assembly Required | No |
| Age Range Description | 8 Years and Up |
| Educational Objective | Problem Solving Skill |
| Item Dimensions L x W | 12"L x 12"W |
| Play Activity Location | Tabletop |
| Manufacturer Part Number | 42906 |
| Manufacturer Maximum Age MONTHS | 1188.00 |
| Manufacturer Minimum Age MONTHS | 96.00 |


Bestseller ranking
Headlamps


![EVEREADY LED Headlamps Pro200 [5-Pack], IPX4 Water Resistant, Bright and Durable Head Lights for Camping, Hiking, Emergency Power Outage (Batteries Included)](https://m.media-amazon.com/images/I/71gjiitg9vL._AC_SL1500_.jpg)
Customers who viewed this product also viewed
Jigsaw Puzzles


Correction of product information
If you notice any omissions or errors in the product information on this page, please use the correction request form below.
Correction Request Form